There’s something almost magical about those early days with a newborn. You blink, and suddenly the tiny baby who fit in the crook of your elbow starts stretching longer in your arms. And yet, even with all that visible change, most parents feel that quiet little question humming in the background: “Are they growing the way they should?”
If you’ve ever hovered over the scale wondering whether a few grams mean anything at all, you’re not alone. Honestly, tracking growth can feel confusing at first, like you’re supposed to know what every number means before you’ve even figured out how to drink your coffee while holding a baby.
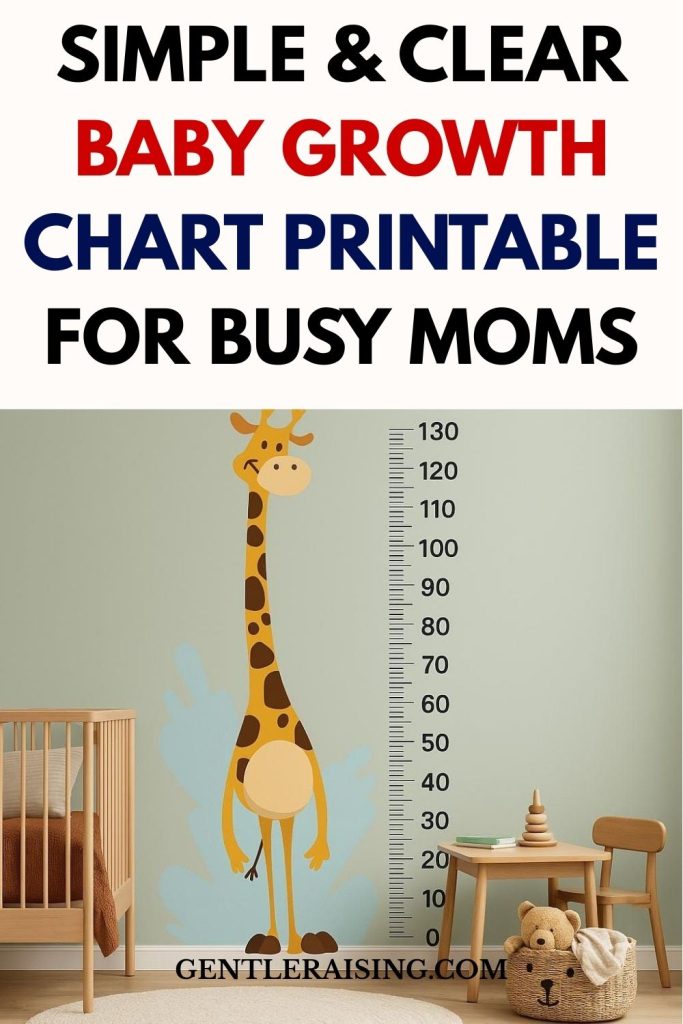
Here’s the thing: growth charts aren’t about perfection. They’re about perspective. And that’s exactly why so many parents love using a baby growth chart printable at home, not as a judgment, but as a gentle visual of progress over time.
So let’s talk about what these charts really do, how to use them without spiralling into worry, and why they end up becoming keepsakes instead of spreadsheets.
So… What Exactly Is a Baby Growth Chart?
A baby growth chart is a visual way to track how your baby grows over time, usually charting:
- weight
- length (or height)
- head circumference
Clinics and paediatricians typically standardise charts based on large population studies, like the WHO growth standards for breastfed babies or the CDC growth charts used in many hospitals. These charts compare your baby’s measurements to thousands of others the same age and sex.
But a printable growth chart you use at home is a bit different. It isn’t meant for clinical comparison—it’s more like:
“Marking height on a doorframe, but cuter, cleaner, and something you can take with you if you move.”
Instead of percentiles and plotted curves, many printables are simple, clear, and designed to show how your baby grows week to week or month to month. And for parents who just want sanity rather than spreadsheets, that’s a welcome shift.
Why Parents Love Using a Printable at Home
Even parents who swore they wouldn’t track every detail eventually find themselves noting something, maybe weight after their baby starts solids or head circumference after a checkup.
Here’s why printables feel different from medical charts:
1. It makes progress visible
Sometimes changes are subtle. Babies grow in bursts, not in straight lines. Seeing tiny jumps on a chart helps you realise:
- “Oh, that sleepy week wasn’t random.”
- “That cluster feeding was leading somewhere.”
2. It keeps everything in one place
No more random scribbles on vaccine cards or the back of receipts.
You can:
- tape it inside a baby memory book
- stick it on the fridge
- Keep it in a nursery drawer.
Simple. Accessible. Not something that disappears behind the couch with the missing pacifiers.
3. It helps reduce comparison (instead of fueling it)
Most new parents don’t want to compare their baby to others, but it happens. A printable shifts focus to:
progress over time, not progress against others
There’s a huge difference between the two.
4. It becomes a keepsake
You may not think so now, but one day you’ll look back and notice:
- The month they doubled birth weight
- the little plateau before crawling
- the huge leap after solids
And you’ll feel this unexpected wave of nostalgia over a simple chart you almost threw away.
What Growth Patterns Really Look Like (Spoiler: Not Straight Lines)
Here’s something many parents don’t hear enough:
Babies don’t grow in a neat, predictable rhythm.
Some weeks, they gain quickly. Other weeks, nothing happens at all. Then suddenly, bam, theipyjamasas don’t fit, and the diapers seem suspiciously tight around the thighs.
A few helpful truths:
- Percentiles aren’t grades
Being in the 10th percentile doesn’t mean a baby is failing. It simply means they’re smaller than average, but healthy babies come in all sizes. - Growth spurts are normal.l
There’s often one around:- 7–10 days
- 3 weeks
- 6 weeks
- 3 months
- 6 months
Although babies don’t read calendars, timing can shift.
- Slow patches happen
Teething, illness, sleep changes, and feeding transitions can all affect growth temporarily.
A printable helps you see the pattern, instead of panicking over a single number.
Different Types of Baby Growth Chart Printables
Not all printables look the same, and that’s actually helpful because families use them differently.
Here are a few you’ll see:
1. Monthly Weight and Length Charts
Simple and clean, usually with:
- a space for age in months
- boxes for weight and length
- room for dates
These are the most popular because they’re easy to keep up with.
2. Head Circumference Trackers
Head circumference sounds oddly specific, but it helps track brain and skull development.
Parents typically measure with:
- a soft measuring tape
- just above the eyebrows and ears
It’s not as intimidating as it sounds.
3. First-Year Combo Sheets
Part tracker, part memory page:
- measurements
- milestones
- first foods
- tiny notes like “slept 6 hours!” or “favourite song: Baby Shark”
These end up in baby books more often than folders.
4. Digital Editable Templates
Usually in:
- Canva format
These are handy for:
- parents who want matching nursery themes
- twin or sibling tracking
- printing clean replacements
Some even come with watercolour animals or minimalist black-and-white designs.
How to Use a Growth Chart at Home (Without Stressing Over It)
Here’s where most parents overthink things. But honestly, keeping track of low-pressure is completely doable.
A few simple tips:
Measure around the same time
Morning works best, before long naps or big feeds, since bellies can skew weight slightly.
Use the right tools
Nothing fancy required:
- a baby scale (home or clinic)
- a soft tape for head size
- a firm, flat surface for length
Quick note: babies bend, wiggle, and occasionally protest like you’re ruining their dreams of freedom. That’s normal.
Don’t stretch their legs straight.
Babies aren’t rulers. It’s okay if measurements are approximate; the point is consistency, not precision to the millimetre.
Record the date and age..
Age is more helpful than the calendar date because development is based on time since birth, not the page of the planner.
And here’s a small side note that surprises people:
Growth spurts often follow sleep clusters.
If your baby suddenly naps longer… something’s brewing.
When to Check With Paediatricians
A home growth chart is helpful, but it doesn’t replace a professional evaluation. Most of the time, small fluctuations are normal.
However, touch base with your baby’s doctor if:
- Weight doesn’t increase for several weeks
- There’s a sudden drop across percentile lines
- feeding becomes difficult or stressful
- fewer wet diapers than usual
- The ababyseems unusually sleepy or irritable
This isn’t about sounding alarms; it’s simply reassurance that if something feels “off,” you never need to second-guess asking for support.
Printable Ideas Parents Actually Use (Not Just Download and Forget)
There’s a difference between printing something and actually using it. Most parents prefer charts that feel practical and visible, like:
On the nursery closet door
Out of the way, yet always there.
Inside a baby journal
Especially versions with space for notes.
Paired with monthly photos
Some parents write:
- age
- weight
- “favourite thing this month”
It’s sweet without being overly complicated.
As a first-birthday keepsake
A growth chart next to a cake smash photo? Beautiful.
Seasonal twist
You can mark big months with:
- holiday sticks
- themed mark, ers
- colours tied to family traditions
Tiny touches make the chart feel like part of your story, not a task.
Features to Look For in a Good Printable
A cute design is great, but it shouldn’t get in the way of usability.
Look for:
- clear spacing between entries
- room for notes (small but useful)
- metric and imperial options
- space for date and age
- simple fonts you can actually read
- neutral or themed versions
Here’s the funny contradiction:
Design matters, but clarity matters more.
Pretty is wonderful. Legibility is essential.
Free vs Paid Printables: What’s Worth It?
You don’t need to pay for a growth chart to track your baby well. Many free versions are perfectly usable.
Free printables work well if:
- You want something simple
- You don’t care about matching sets
- You just need a functional record
Paid versions make sense when:
- You want editable fields
- You’re printing on high-quality paper
- You want matching milestone cards
- nuNurseryécor matters to you
- twins requiseparateted tracking
Parents who love organised aesthetics (or Canva templates) usually enjoy paid sets. Others stick to free printouts tucked into a folder, and both approaches work.
How Often Should You Track Growth?
This is where anxiety can either skyrocket or melt into something manageable.
Here’s a helpful rhythm:
Newborn to 2 months
Weekly or every other week is enough.
2 to 6 months
Once a month works well.
6–12 months
Monthly or even every 6–8 weeks.
Daily weighing is rarely necessary and often raises stress for no reason.
You’ll usually notice changes through:
- feeding patterns
- sleep shifts
- clothing size
The chart is simply a visual companion, not a daily report card.
Common Growth Chart Mistakes (Totally Fixable)
Parents aren’t doing anything wr; ng, these are just easy pitfalls.
Comparing babies
Even siblings can follow completely different curves.
Switching charts frequently
Stick with one format so the pattern stays consistent.
Using different scales each time
Scales vary. Try to use the same one when possible—even clinic-only tracking works fine.
Measuring length alone
Weight, length, and head circumference together tell a clearer story.
All simple, all fixable.
The Memory-Keeping Bonus Nobody Talks About
You may start tracking growth for reassurance, but something happens along the way.
Months later, you notice:
- the week solids began
- that first huge leap after crawling
- the tiny plateau during teething
- handwriting shifts from nervous to confident
And suddenly, what felt like a data sheet becomes a snapshot of early parenthood.
Some families tuck the chart into:
- a shadow box
- a first birthday time capsule
- a scrapbook
- a digital baby book
Funny how something practical turns into something sentimental without trying.
Step-by-Step: Printing and Displaying Your Chart
Nothing complicated here, just a quick guide.
Paper
Regular works fine, but cardstock feels sturdier.
PrintiThe home
The home printer is easy. If you want colour:
- local print sho, ps
- online photo printer, rs
- office supply stores
Writing tools
A fine-tip pen or thin marker prevents smudging.
Lamination
Optional, but great if:
- you’re using dry-eYoue
- You want it to last
- You have multiple kids
Tape, clip, frame, whatever fits your space.
A Few Special Situations Worth Mentioning
Preemies
Their growth often follows adjusted agPaediatricianssans can help interpret patterns.
Twins or multiples
Separate charts prevent unhelpful comparison and keep each child’s progress personal.
International differences
Some countriescentimetreseters and kilograms only. Many printables now include both to avoid conversion headaches.
Final Reassurance Before You Go
Here’s something worth repeating gently:
Babies grow at their own pace.
A growth chart is not a scoreboard. It’s simply a companion, a quiet record of change that often only makes sense when you look back.
One day, you’ll notice you stopped tracking not because you stopped caring, but because you started trusting. And when that moment comes, you’ll have a paper trail of progress that tells a story no numbers ever could.
So print the chart. Fill it in slowly. Miss a month and laugh about it later. Because the truth is, growth happens whether you track it or not, but capturing it turns ordinary weeks into something you’ll treasure long after the baby stage ends.